


Ad viewability remains a core indicator of advertising effectiveness. Even with advanced targeting, automation, and machine-learning optimization, an ad only matters if a human actually sees it.
That plain truth makes viewability the baseline for judging return on ad spend, creative performance, and channel selection. Yet for many organizations, measuring viewability accurately and using the data responsibly is still harder than it sounds. Differing methodologies by vendors, gaps in platforms, and incomplete data feeds create blind spots that skew performance insights.
With that in mind, this guide walks through the five viewability metrics with which practitioners spend the most time, explains how to interpret those metrics in a meaningful way, and calls out three pitfalls marketers are most likely to encounter. These observations come from hands-on experience implementing viewability measurement for enterprise advertisers and helping teams set up reports that drive real business decisions.
This article is part of our Ad Metrics series. For more information, check out: The 2025 Ad Metrics Playbook.
Top 5 metrics for measuring viewability:
1. Viewability rate
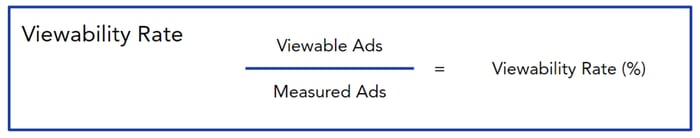
The viewability rate is the most cited metric because it shows the share of measured ads that hit the viewable threshold. This percentage lets you compare placements, creative formats, partners, or tactics and quickly spot where your media is most likely to be seen.
You calculate it by dividing the number of viewable impressions by the number of impressions that were successfully measured. It's simple, but becomes far more powerful when used to benchmark partners or uncover structural issues, like poor placements or overly aggressive frequency tactics, that may be harming campaign impact.
2. Average time in view
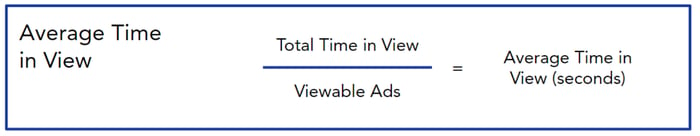
A viewable impression confirms visibility, while the average time in view shows for how long it stayed visible. This distinction matters, particularly for formats like display, where time contributes heavily to recall. It is obtained by dividing total time in view by the number of viewable impressions.
Longer visibility often signals quality placements, stronger on-page relevance, or less cluttered environments. Paired with creative analytics, it can reveal which assets hold attention longer.
3. Quartile viewability rate
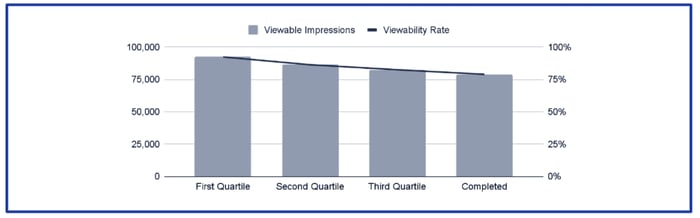
Video introduces an additional layer of nuance. A single ad can become viewable and then drop out of view as users scroll down the page.
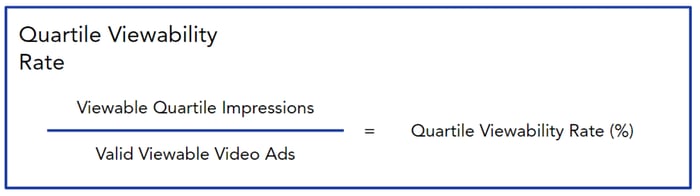
Quartile viewability gives insight into whether or not the ad was visible through 25%, 50%, 75%, and 100% of the video. Such detail helps to identify the drop-off points that map how users are behaving or which placements are suboptimal. For example, strong first-quartile visibility but sharp falloff mid-way may point to issues with page layout or auto-play environments that shift the user’s focus too quickly.
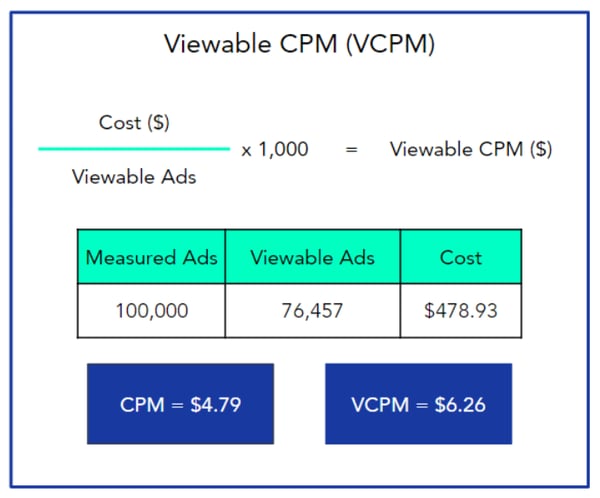
4. Viewable CPM
vCPM reframes cost through the lens of what actually could deliver value. By focusing on the cost of only the viewable impressions, rather than all impressions served, you can compare partners on a more realistic, performance-aligned basis. This lets you compare partners on a more realistic, performance-aligned basis. It's a pretty useful insight in budget justification conversations because it can tie efficiency to what users actually experience. A low CPM is meaningless if half the impressions were never visible.
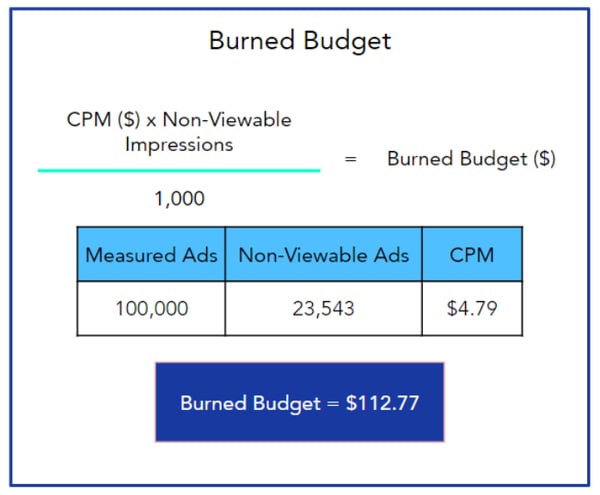
5. Burned budget
Burned budget measures the amount of spend that went to non-viewable impressions. Simple but powerful, it's one of the most compelling metrics to share with stakeholders as it makes wasted spend easy to grasp. Teams use burned budget not only for diagnosing issues, but also to advocate for changes, such as shifting spend to higher-quality suppliers, negotiating better placements, or setting and enforcing stricter viewability thresholds at the buying strategy level.
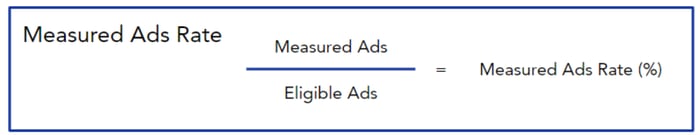
Bonus Metric: Measured ads rate
While the viewability rate captures the percentage of impressions that were measurable and considered viewable, the measured ads rate represents the proportion of total served impressions that were actually measured for viewability. A high measured rate gives confidence that the dataset represents reality. A low measured rate indicates that optimization decisions may be based on partial evidence, increasing the risk of misinterpretation.
3 common pitfalls when measuring ad viewability, and how to avoid them
Even advanced marketing teams can trip over structural issues that distort viewability metrics. Anticipating these challenges helps keep analysis grounded, comparable, and actionable.
1. Connecting viewability and media data
This is often captured by a third-party vendor, while impression and spend data come from DSPs and ad servers. It can be hard to tie these sources together at a granular level when naming conventions differ or identifiers can't be passed between systems.
This misalignment can be minimized by following tips:
- Use strict, consistent naming conventions across platforms
- Ensure campaign, placement and creative identifiers exist in both environments
- Accept that at times, perfect one-to-one matching may not be possible and that aggregated-level insights may be necessary
With Gartner reporting that 80% of digital marketing leaders struggle to define a consistent set of metrics and methods for measuring multichannel impact, there is clearly a need for a unified measurement framework across viewability and performance metrics. Following these steps will instill trust in the data by reducing the chances of drawing conclusions from mismatched or incomplete datasets.

2. How to navigate walled gardens
Large advertisement ecosystems can limit third-party measurement. When the platforms introduce their own rules, sometimes marketers rely on in-platform solutions or specific accredited vendors. This can reduce cross-channel comparability and make it harder to evaluate performance from a single source of truth.
Ways to mitigate:
- Select a viewability vendor that has extensive integrations across major platforms.
- Where possible, consolidate measurement partners to ensure methodological consistency.
- Document platform-specific limitations so that analysts and stakeholders know how to interpret the data.
Transparency is paramount here, otherwise teams run the risk of comparing metrics that don't align methodologically.
3. Sample sizes and unmeasured impressions
Even with solid tech in place, some impressions go unmeasured. A high volume of unmeasured ads doesn't exactly invalidate the data, but it can reduce confidence in using it to optimize.
Best practices include:
- Tracking a ‘measured rate’ on dashboards to reveal how much of your media activity is being evaluated.
- Investigating sudden drops in measured rate with your vendor.
- Avoiding major business decisions when the measured dataset is unstable or unrepresentative.
A consistent, measured rate provides your organization with the transparency needed to trust and act on viewability insights.
Conclusion
Strong viewability measurement isn't just about clean dashboards. It empowers smarter planning, leaner budgets, and more resilient data practices. If marketers focus on the right metrics and understand measurement limits, they can have greater confidence and precision in assessing campaign impact to ensure that media investments reach real people and drive meaningful outcomes.


