


Data storytelling is the ability to communicate insights through data that lead to actions that will positively affect the business. As such, it is fast becoming an essential skill for almost anyone to have, including marketers.
However, marketing data storytelling within organizations, especially big ones, can be a challenge. Often insights can be overlooked because they have been communicated to the wrong people, in the wrong way at the wrong time.
In this post, we present our top eight data storytelling methods that will help ensure your data insights not only reach the right people but are also acted upon.
TLDR? Watch the video instead!
Check out our full agency guide to data storytelling!
1. Standard reporting
The regularity of standard reporting, making use of dashboards or templated reports, can help to demonstrate the effectiveness of the actions being taken and allows you to keep key stakeholders up to date on results. But be careful. Too regular, and additional insights may not be queried often enough and some people can feel overwhelmed with the number of reports they get. Plus, always keep in mind that the period between insights acted upon and the next report may not be long enough to prove the effectiveness of the action being taken.
Pros:
- Establishes a good routine on which to build.
- Can help to demonstrate the effectiveness of action being taken.
- Making use of dashboards and templated reports saves time.
Cons:
- Can mean the data is not queried
enough, leaving insights undiscovered.- Some people can feel overwhelmed by the number of reports.
- The time between insights acted upon and the next report may not be long enough to prove the effectiveness of the action being taken.
2. Talking to People
Sounds obvious but the value of simply having a conversation with the person you know who needs to hear a particular insight is huge. Whether that is a Slack message, a meeting, or just an informal chat by the water cooler, direct communication is often one of the best ways to ensure insights are genuinely listened to and often leads to actions being taken.
Pros:
- Direct communication can lead to actions being taken quickly.
- No time is lost in formatting communications to share insights.
- Utilizes existing internal communications tools (Slack, Teams, etc.)
Cons:
- More difficult to track how the insight has led to action.
- Not suitable for all audiences.
- It is possible for some people to be left out of the conversation.
3. Sharing Dashboards
Sharing dashboards used for analytics and optimization enables fast sharing of data and insight and helps you easily tell a story with data. The main downside of this method is the fact that not all dashboards are built for universal audiences and might contain too much data for a wider audience to understand.
Pros:
- Reduces time to visualization and enables fast sharing of data and insight.
- Highlights different data points and tells stories with data.
- Allows the audience to see more data than just the insight, to get a fuller picture and derive their own conclusions.
Cons:
- Dashboards need to be adjusted to cater to wider audiences.
- Sharing dashboards must comply with existing data governance procedures.
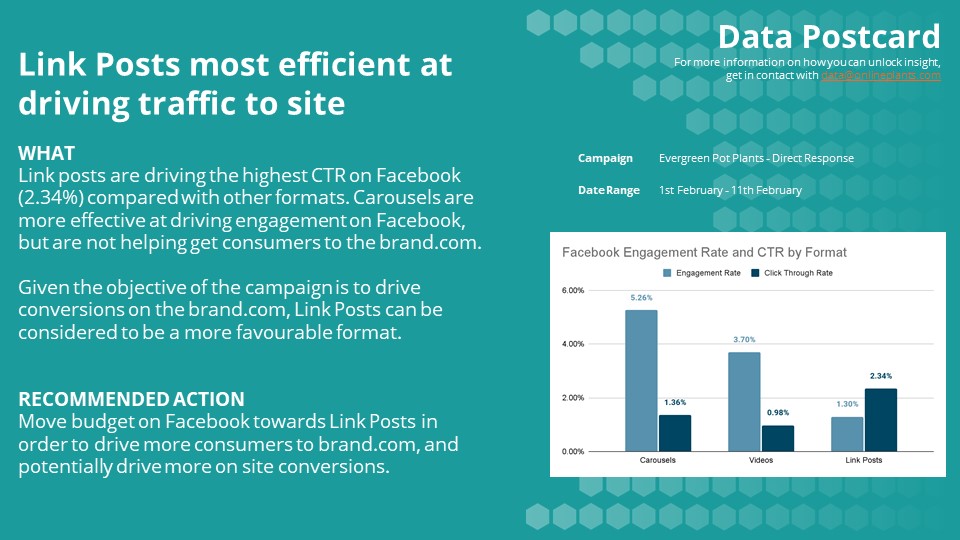
4. Insight Postcards
Insight Postcards are a simple method to communicate the “what”, “why” and actions of an insight. Given their brief nature, they can be useful for punchy insights, and also can work well with a less digitally mature audience. Keep in mind that postcards may not be as useful for more complex insights.
Pros:
- Simple and consumable method for sharing and reading insights.
- Allows for easy sharing of insight with a specific person who can ensure action is taken.
- Creates a record of insights and who they were shared with.
Cons:
- A postcard template needs to be created.
- Increased time to action compared with talking with your stakeholder.
- Less useful for more complex insights.
 Insight postcards are simple but effective method of data storytelling
5. Infographics
Data infographics are custom-made, longer-read ways of really telling a story through multiple data visualizations. If used on a regular basis, they can really help to summarize what has happened and show where success occurred and what lessons were learned. However, beware that considerable time may need to be invested in developing infographics, and this will probably require input from internal or external design teams in order for the infographic templates or elements to be developed.
Pros:
- Can create a story-driven approach that breaks down more complex insights and concepts.
- Can capture the attention and interest of the reader.
Cons:
- Significant time is required to design infographics shortening time-to-value.
- Infographics tend to only cover a single data story, limiting their usefulness.
Tip: Keep a track of the insights you share with the Adverity Insights Success Tracker Template!

6. Use Cases and Success Stories
These resources can act as valuable demonstrations of the effect that finding an insight has had on the business. Where insight has led to action, these can act as advocates for the value of paying attention to insight.
Pros:
- Demonstrates the power that acting on insights has had on tangible objectives.
- Acts as a method of recording the successes of insight that were acted upon.
- Can demonstrate the variety of insights and actions that have been observed and taken within the business.
Cons:
- Impossible to guarantee regular use cases and success stories.
- Considerable time and effort are often required.
- It is possible for use cases to be quite similar, reducing the breadth of learning.
7. Regular Newsletters
Regular monthly newsletters can act as a way of talking about what has been happening within the business, as well as communicating success and developments. Newsletters can be used to highlight multiple success stories and applications of data and insight, but they require a wide range of content that needs to be brought together in order for them to have the most value. And be aware that, despite all the hard work you put into making a newsletter, it can still get ignored in people’s inboxes.
Pros:
- Used to highlight multiple success stories and applications of data and insights.
- Can reach large audiences across the business.
- Regular delivery can help to establish a data-driven culture.
Cons:
- Require a lot of content to be valuable.
- Are often ignored in people’s inboxes.
- Less likely to be targeted to specific people or teams.
- Not useful for driving immediate action from insights.
8. Regular Talks and Data Summits
Of course, at the top of the list, are in-person events, and internal summits of the whole company or certain departments. This method implies delivering talks around data and insight, featuring internal and external speakers. It is an opportunity to talk about previous successes, and new ideas and engage an already data-driven and interested audience. Summits can be a big investment in time and money, and it will need to be someone’s tough responsibility to set the agenda, find the right speakers, and turn these events into real success stories.
Pros:
- An opportunity for data and insight to take center stage.
- Teams can share their successes as well as lessons learned.
- Regular talks can drive a data-driven culture.
Cons:
- A big investment in time and money!
It’s all about timing
The methods you choose will depend on your business and your overall data storytelling strategy. However, we recommend trying to include at least three or four different methods to ensure different audiences around your company are reached. However, once you have decided on the appropriate methods, it is vital to determine a schedule for the frequency for each.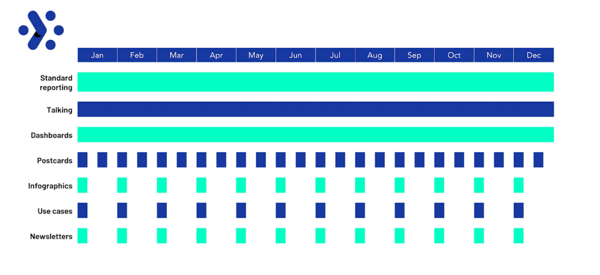
Standard reporting and sharing dashboards, as well as talking with your colleagues, are things you should be doing all the time. But when you start looking at more advanced methods such as postcards, infographics, and newsletters, you need to consider how regularly you do these.
Anything from every two weeks to monthly or quarterly is appropriate depending on the size of your company. And for data summits or talks, they may even be just annually given the size and effort that goes into them.

