


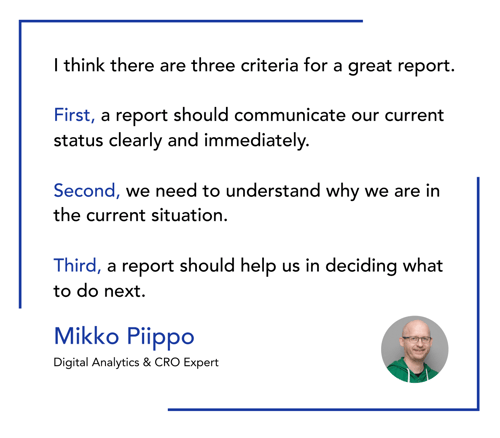
Every marketer and data analyst knows: the struggle around reporting is real.
No matter how well your campaign performed or how much you helped increasing sales – when it comes to creating a meaningful report for your boss or client, it’s really hard to convey the perfect message.
When it’s your time to shine it is important to find the right balance between bragging and critical thinking, especially when your CMO does not care about your vanity metrics at all.
I’m sure you will agree, it can be a real challenge to produce compelling marketing reports.
The more data you generate with your marketing activities, the more work you create for yourself.
While you may have great insights to hand, if you cannot present them in the right way, they’re not much use to you. Or if you’re in the tough spot of delivering daily reports to an overly curious client, the workload on reporting gets out of hand quickly.
Luckily, there are amazing marketing reporting tools out there to help! Once you have your data ready, you want to analyze it and present it in a way that everyone can understand. Without a big hassle.
Marketing reports are there to visualize your data and convey the message behind it.
On this page, you will learn everything there is to know about marketing reports, what you need to make them work, to make them pretty and to impress your boss or your clients.
Here’s a rundown of the topics that we’ll be covering:
Marketing reports are the outcome of your Data-driven marketing. They help make sense of all your data through easily digestible visualizations. In turn, your insights can be understood by anyone involved in business decision-making.
Marketing reports can justify your efforts and highlight the successes of your work. They can identify trends, as well as point out even the smallest details and explain how they contribute to your marketing ROI (return on investment).
In other words, marketing reporting helps build a context around your data. It helps tell a story.
If you were to compare data-driven marketing today with that of five years ago, you’ll probably be surprised at how much things have changed. From tracking visits per page, bounce rates and cost per clicks, today companies have evolved to crunching tons of complex data every day.
While for many, the end goal is to offer customers the most Personalized experience possible, data-driven marketing can also help meet other objectives. Think about acquiring new customers or proving your marketing ROI, for example.
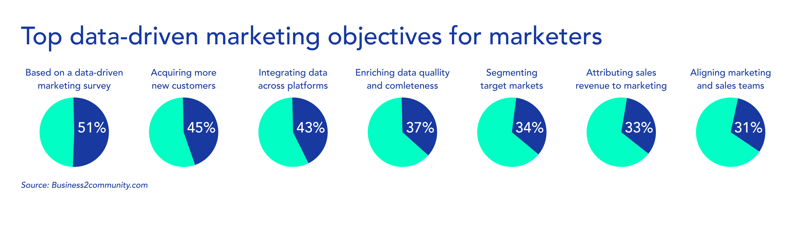
If we were to choose our top three objectives of data-driven marketing, we’d go for:
Now, let’s look at those points one at a time.
1. The first objective is perhaps the most important. Knowing where exactly customers are on their journey is key to offering them what they need.
Do they want to be reached on their mobile device? How much are they willing to spend? When do they plan on making a purchase?
To find answers to these questions, you’re going to need rich, quality data. Don’t underestimate it. Once you have all the details at your fingertips, you can then offer what each customer is looking for. Yes, that is each customer individually.
Remember: marketing personalization is king.

2. How about measuring and proving the return on your marketing activities? Don’t worry, we feel you. It is probably the biggest challenge for marketers out there.
Though, ROI remains one of the most important metrics. There, we said it. Gartner said it, too. Today, more than ever, you are expected to prove the positive financial impact of your marketing efforts.
Measuring your marketing ROI is not always a straightforward process. In order to know what to focus on, you need to use the data you collect and apply it to your business context. Will it be your entire marketing mix or only part of it? Will it be comprised of one single platform or multiple channels?
Consider the variables before you dive into the calculations.
3. The third point on our list is aligning goals and actions, particularly between the marketing and sales departments.
Marketing and sales teams often work too disconnectedly. Though, it is crucial that data flows freely across the organization – without getting stuck in silos. This way each team can take the necessary steps to hit the company’s targets.
Imagine that during the course of a campaign, the sales team realizes that revenue is below forecasts. They may not have an indication yet as to why, but they can already alert marketing to look into the issue and possibly adjust their strategy.
If a marketing report finds that a certain message does not resonate with its target audience, the marketing team can look for a solution to bring sales back on track.
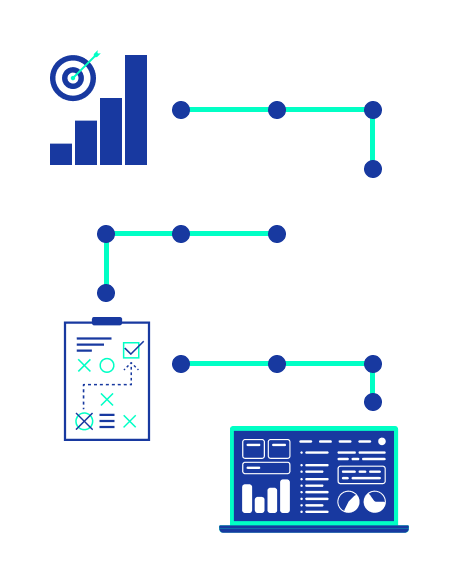
As we’ve already highlighted, data can be a hugely valuable resource for shaping your marketing activities and understanding how they translate into results. That said, making effective use of your data isn’t without its challenges.
We’ve outlined six of the most common challenges faced by marketers.
This is, of course, easier said than done. Even the highest quality datasets are restricted by asking the wrong questions.

What’s key to this process is looking beyond vanity metrics. While Google Analytics may tell you how many visitors your website receives, this will not help you optimize your content delivery and drive more organic visitors.
Asking the right questions from your data and identifying the most important KPIs is crucial to creating compelling marketing reports.
By setting goals and questions you want to be answered, your marketing activities can be better geared towards delivering measurable results.
Instead, a continual focus on your end goals and reporting on your progress will ensure that you can better optimize the delivery of projects.
As marketers use an ever-growing list of marketing and sales tools, the quantity of inflowing data will continue to rise.
The raw data that is supplied by these platforms is often quite messy. When working with data from different platforms, you’ll quickly discover that they’re formatted inconsistently – making cross-channel marketing reporting extremely difficult.
Large datasets will not automatically provide you with useful insights. You’ll need to use High-quality datasets to generate better marketing reports.
In other words, you’ll need to have a consistent target data schema. High-quality datasets are considered to be consistent, timely, relevant and accurate.
Marketing is becoming an increasingly specialized discipline, which means marketing professionals now need to become proficient data managers and analysts.
Fortunately, by having the right data integration tool at your disposal, you’ll no longer need to retrieve your data manually. Data is delivered in a harmonized format that’s immediately ready for your analysis.

Raw data is also usually fragmented between platforms and departments – often resulting in many datasets or silos.
Silos are a marketer’s worst nightmare. They provide no single overview of all the data that’s available, which makes it difficult to detect trends and outliers.
The solution here is simple. Everyone in your company should be working with the same datasets. All your data should be available to view within one central platform that’s accessible by all.
Having high-quality and harmonized datasets is one thing, but the ability to derive powerful and actionable insights is a whole different ball game.
You need to be able to identify what’s relevant and where you’ll find the answers to your questions.
Luckily, marketing analytics makes this process much easier. With the right software, you can better understand which marketing activities resonate with your customers and target audience best.
The better you are at interpreting your data, the better informed you will be when sanctioning decisions. Data-driven marketers can respond quicker to emerging trends when they do not need to wrangle their data manually.
In short, marketing analytics platforms provide you with the tools to find more reliable answers quicker than with any other manual reporting process.
Delays often arise when attempting to manually compile and visualize real-time data – reducing your ability to Respond quickly.
Further challenges arise when attempting to turn real-time data into actionable insights. Being able to derive insights and respond quickly to them is key to delivering quick wins to improve ROI.

A recent report found that very few companies have fully integrated data systems. Most respondents had some connections between systems in place. Though, rather alarmingly, spreadsheets are still a common fixture of marketing reporting. As data volumes continue to grow, integrated marketing analytics is crucial to getting the most out of your datasets.
Although many businesses are still lagging behind, most acknowledge the vast potential in turning fragmented raw data into smart business insights.
You may have noticed that there has been quite a hype lately about this thing called real-time marketing. It’s only logical, right? You want to be where your customers are at just the right time.
You want to be there when the comments come so you can answer them. You want to be there when a customer has a specific need so you can meet it. Real-time marketing is about owning the conversation, devising the right content marketing strategy and being relevant.
Easy peasy – or so you’d think. Making real-time marketing happen, you need to rely on the data you collect to be accurate and timely. You cannot expect to run your marketing campaign from start to finish without anything changing (even if only slightly) in the meantime.
Focus on A few main KPIs and track them carefully. Continuously, too. Whether that would be the number of visitors to your website, your best performing content or conversion rates, is up to you. But do make sure you are monitoring the right data that will help you prove the success of your marketing efforts.
Let’s take an example.
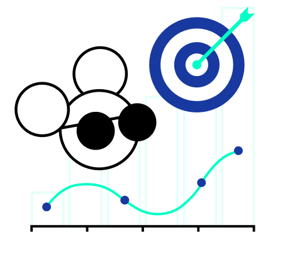
Say you want to find out to what extent customers engage with your brand compared to your competition. You would then be looking at your share of voice (SOV).
Put simply, SOV “details what percentage of mentions within your industry are about your brand, and what percentage is about the competition,” According to Hootsuite. The following infographic gives a pretty clear idea of what it is all about: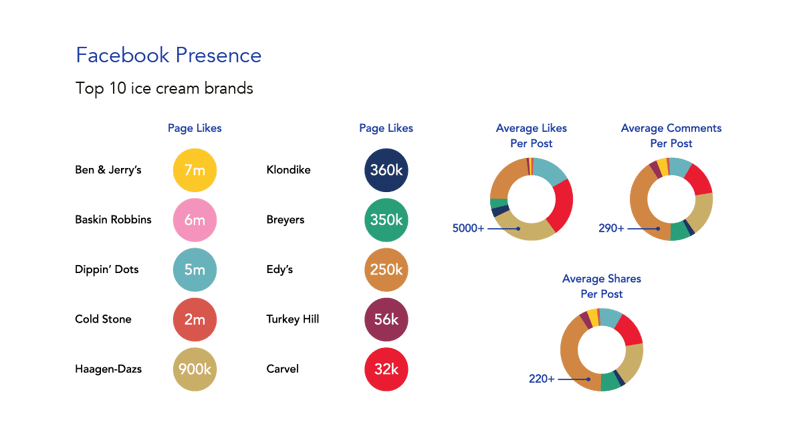
Social media is about being present in the moment, which is why SOV is something to monitor and influence on an ongoing and real-time basis. It’s important to look at the right data to better understand your objectives and how to achieve them. The more you want about your customers, the better equipped you are to engage with them. Similarly, the better engaged you are, the more attention you will attract. By making yourself available, more people will reach out to you.
Brands with a smaller following often end up being more recognizable on social media. That is because they are often more active. Of course, Facebook is just one example, but this concept applies to every other social network, blog or website. Be there or be square.
Turning your marketing data into smart insights is every marketer’s dream.
It is the moment of deriving real value from your once messy and scattered data that is the most cherished. But don’t forget: getting your hands on those great insights is not the end of the journey. You still need to present them – for that, you’re going to need to visualize your data using dashboarding software.
So, let’s get to it. How do you make your Dashboard look the best it possibly can?
Always remember that we, human beings, are visual creatures. A picture is worth a thousand words, right? We simply process information more easily and quickly when it is displayed visually, rather than lines and lines of text.
That said, you shouldn’t give up on text altogether – you can tell we love it! Though, the text you do use should complement the overall marketing report. Here’s a list of tips that we’ve put together for you:
At the end of the day, what you want to have is a convincing and good-looking marketing report. Get creative and don’t be shy. The sky’s the limit.

Before you get to the point where you can visualize your findings, you have to ensure that everything – from data collection to careful analysis – has been performed well.
We trust that you are able to derive some great insights from your (already clean and harmonized) data. Though, the process of visualizing data in a coherent report isn’t quite as straightforward as it may first appear.
At this point, you might think you are ready to create your marketing report. But before you jump into producing cool visualizations, you still need to think about the following:

Yes! Now you can go ahead and create your marketing report. It can be a long process to reach this point, but it is all worth it in the end.
Each consideration is an important part of the process, so make sure you carefully assess them one by one. Your marketing report needs to be clear, good-looking and to the point. Only include information that will improve its value and remove anything that may bring it (and you with it) down. Your clients will thank you for it.
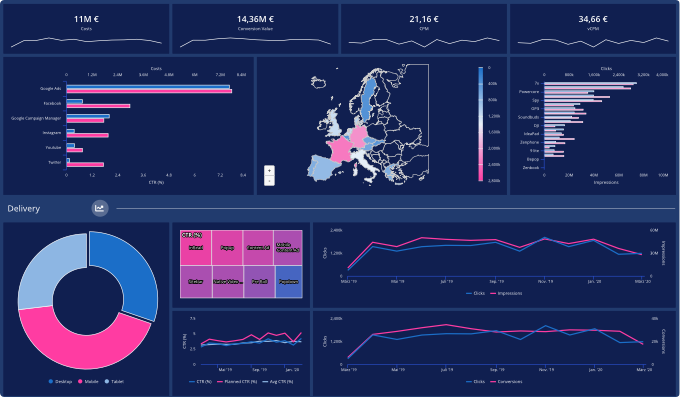
For marketers, dashboards may well be the best thing since sliced bread. They make findings look nice and pretty, structure messy data into graphs and bars and charts, and turn complex insights into something readable. As great as that may sound, dashboards do have their drawbacks.
Without a doubt, Dashboards are great for monitoring long-term trends. Do you want to know how your advertising campaigns have been performing over the year? Dashboards can provide you with all the insight you need, including:
Still, with data volumes growing exponentially, marketers are starting to focus less on timely data. The downside of doing so is that data presented in dashboards may not always be representative.
Analyzing data points on a daily, perhaps even on an hourly basis, can limit your view of your marketing efforts. Instead of managing the big picture of how and where things are going, you might end up over-analyzing bits of information that arguably have no real value to the bottom line of the business.
The risk here is that dashboards become an end instead of a means to an end. What you don’t want is to focus on small sets of data and forget about the insights that define the course of your marketing strategy. What’s more, it can make you more reactive. You can find yourself responding to day-to-day trends and not on your end goals.
“To avoid the ‘more is better’ trap, step back and carefully delineate the role a dashboard should play in marketing decisions. A useful dashboard can help set goals, monitor performance, provide implementation metrics and help to provide strategic insights.”
Vikas Mittal, the American Marketing Association
Dashboards will continue to be a hugely valuable resource to every marketer. Do make sure, however, that your dashboards are not too focused on daily input, but are rather in line with your overall marketing and business goals. You will feel the boost – and so will your marketing.
ROI is a crucial metric for the majority of CMOs.
(Yes, we can see you nodding along already.)
The main reason to measure your ROI is to avoid spending money on marketing activities that don’t generate enough revenue and/or qualified leads. It’s a simple truth.
CMOs are, thus, increasingly expected to prove the positive financial impact of their work – and many seem to be on the right track.
A recent Report by Gartner showed that the largest share of marketing budgets is spent on marketing analytics, which is a sign that marketers are willing and able to measure their performance and ROI.

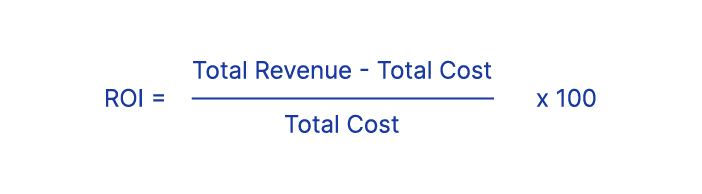
At first glance, measuring your marketing ROI may seem like a rather straightforward thing. For instance, you could simply plug your performance data into a simple formula, such as:
Still, ROI is not a one-size-fits-all concept. You need to base your calculations on the specific business context and decide whether you want to focus on:
Taking your business context into account is particularly important since the highest marketing ROI does not always translate into the highest long-term profit and value for your (or your client’s) company.
“The idea is to maximize profit, not necessarily MROI. It’s basically the difference between being efficient (obtaining high MROI) and being effective (driving maximum profit and long-term value).”
Daniel Kehrer, Senior VP of Marketing at MarketShare
Try out different approaches before deciding on the one that works best for you.
A recent survey among 2,500 digital marketers identified the efforts that generated the highest ROI, with email marketing being the most cited among agency professionals, followed by content-, social media marketing, and search pay-per-click (PPC).
The question is, which marketing activities are the most suitable and effective for your business?

When it comes to creating marketing reports, there are numerous metrics you could consider looking at. Most likely, you are already tracking the number of visitors to your channels, your leads, customers, and conversions. That’s great!
The next step from here would be to make your marketing reporting more specific, focusing on the things that make the most sense for your business.
The key to this type of marketing report is to identify the channels that bring the most value to your marketing activities. Whether that’s a blog, a social network or an e-commerce platform, there are to be at least one channel that contribute the most to your bottom line. Pinpoint them and make sure to invest your energy and resources in them. The ones that do not perform as well, on the other hand, can take a backseat.
Marketing ROI is king, remember?
Together with channel-specific marketing reporting, revenue reporting can help you understand which platforms bring the most leads and conversions to your business, and which ones only waste your time and money.
The challenge here is to allocate certain revenues to the respective channels that generated them. More often than not, marketing campaigns make use of multiple channels at the same time, so it is difficult to determine which channel was responsible for the sale.
As part of your report, you should include all the metrics that help to piece together the complete picture of your revenue generation – and the channels that convert customers.

Nowadays, leads originate from different channels and platforms – including paid search, organic search, and social media. Just like with revenue reporting, it is not always clear which channel contributed to which lead.
Social media and email marketing are two of the main contributors. Every scroll past a LinkedIn post or every click on Instagram is a potential new lead in the making.
Blog posts, too, are an important source of new leads generated.

Good content has turned many brands into thought leaders and convinced once potential customers to become regular consumers. Tracking the performance of your blog and the (recurring) visits that it generates is, therefore, crucial.
Your marketing reports should dig deeper into what kind of content works best with readers. Use these findings to shape your content strategy and invest time and money into producing more of that content. Experiment with new ideas and see how they are received by your target audience. In short, a lead report can establish stronger relationships with your customers.
Determining the right marketing reporting tool for your business depends very much on the amount of data you have coming in, what you want to do with it, and your budget.
Are you on a tight budget? Google Data Studio might be for you then. It’s free, powerful and easy to create dashboards and reports with.
And if not, here’s a list of the top tools out there:
HubSpot – don’t we all love them?
Klipfolio – the top-rated dashboard on Earth, they say.
Google marketing platform – an analytics platform for smarter marketing and better results.
Tableau – an award-winning visualization software and among the prettiest visual analytics tools available.
Cyfe – Social media, web analytics, marketing, sales, support, infrastructure… monitor everything!
Now, if we were to look at everything we’ve already mentioned and provide it under one view, you will have a much-desired, kick-ass report.

The way we see it, a kick-ass marketing report consists of the following four elements:
It is extremely important to choose the right data analytics tool! The right tool will lead to the right insights and better marketing decisions. Most marketers still use Excel for their reporting but the problem is that they are outdated once you send them and more importantly, close to 90% of spreadsheets contain errors.
Our brains are not programmed to read too much text at once or understand a lot of data in tables. What’s better? Graphs!
It’s important to know your audience. Bring together all relevant KPIs to complete the big picture. At the same time, keep in mind who you are talking to and be sure to provide each target audience with the information that they are most interested in.
We like to compare this to the layout of a car’s dashboard. Different driving styles deserve a different focus. It’s obvious that the different audiences focus their attention on different numbers.
Here’s a real-life example who in your company needs what type of information:
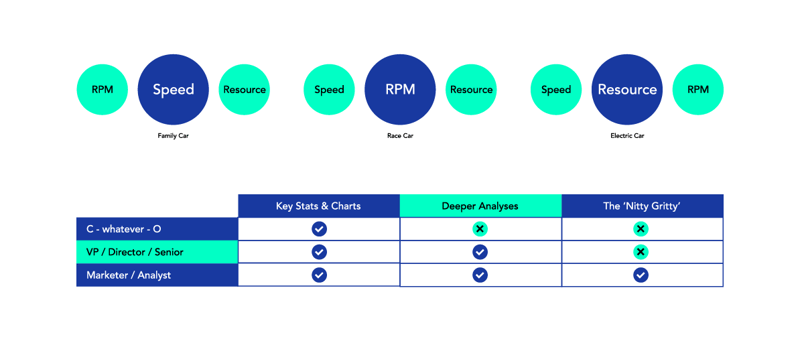
It’s clear that not every member of your top management needs the in-depth engagement numbers from social media. Or the CTR from your email campaigns. Rather, they’re focusing on the bottom line and a global perspective of activities. So, to break this down even further, here’s what you get:
 Marketer / Analyst
The C-suite cares about your impact on the business, namely on revenue, top-line and bottom-line. They’re also especially interested to learn about the customers you bring in: what type of customers they are and their longevity. You get the point. Work backward from the business goals and identify the marketing metrics that you have the power to improve. But how do you make the most impact? Focus on these three final points:
Your kick-ass marketing report should be comprised of metrics, visualized insights, performance data relating to your current inbound marketing strategy, as well as an outlook for the future.
Always tell your business leaders about what you have achieved, but also what could be improved and how. Paint the complete picture of where your marketing efforts are going. Convince them of your course of action.
Together with a great marketing report, you are sure to win points for your department.
