Audience behavior is becoming increasingly complex. There is more content than ever before, across more channels than ever before, and more devices upon which to consume that content than ever before.
And, because of this, audiences are more demanding than ever before.
Simply put, Audience Analytics is the process of integrating audience data from multiple sources, building a detailed picture of your audience and audience segments, and then analyzing that data to reveal insights and inform strategy.
Well, by developing a detailed understanding of your audience, you can develop better, more targeted content, deliver it at the best time, and across the most effective channels, to increase engagement, enhance acquisition, and ultimately drive revenue.
Understand how, why, and when your audience is subscribing to your platform, consuming content, or purchasing tickets – use this knowledge to boost acquisition strategies.
Access huge amounts of audience data to understand what content resonates best and feed this intelligence into your content development strategy.
Go one step further and target specific audience segments with one-to-one content developed just for them.
Understand when, where, and how your audience consumes content and use this to optimize your scheduling and channel strategy.
Enhance audience engagement and build an accurate picture of how they feel about your content with in-depth tracking of social media channels.
Optimize advertising conversion rates and provide detailed audience feedback for sponsors to attract and retain higher revenues.
Understand how, why, and when you are losing subscribers or viewers and use this knowledge to reduce audience churn.
The M&E industry has access to a huge amount of audience data. But, this needs to be harnessed correctly. One of the first steps is to master data governance.
To even start to understand how your audience interacts and engages with their content, you need to connect to the right data. Which data will depend on your business, however, it helps to group your data sources into the types of data they are providing.
Don’t only look to the most obvious data sources. By connecting with different, less ordinary, datasets you can draw out some truly valuable insights.
For example, if you have live events, integrate weather data to see how this is impacting ticket sales. Or, by connecting to platforms like Brandwatch, Sprinklr, or Hootsuite, you can start opinion mining.
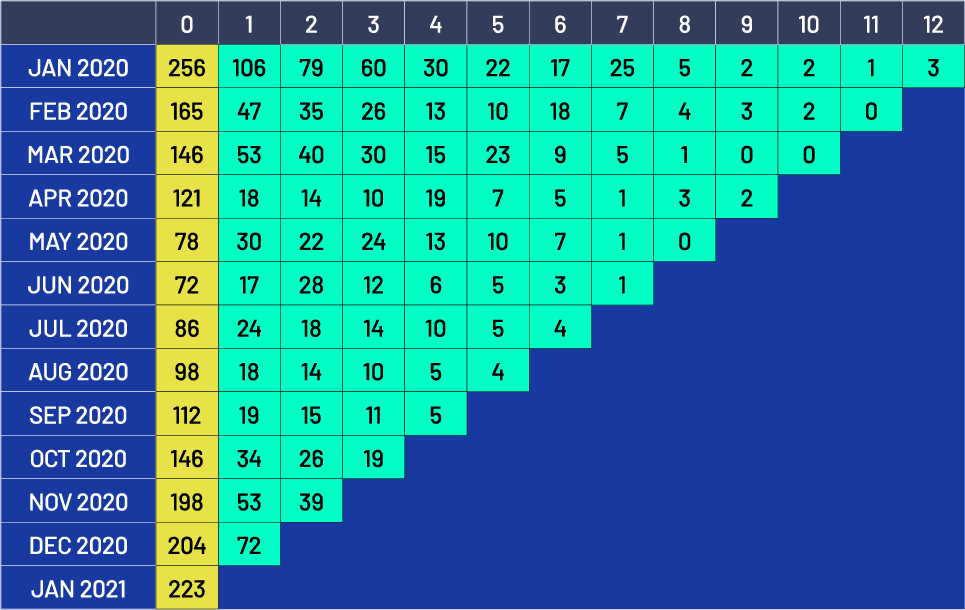
Once you have the right data, you can start identifying the right metrics and KPIs to track.
Broadly speaking, you can split these between metrics for tracking performance on the one hand, and KPIs for tracking engagement and revenue on the other.
Impressions, Clicks, Costs
Total Reach, Follower Growth
Circulation, Unsold Copies, Readership
Users, Sessions, New Users
Impressions, Clicks, Referring Domains
Audience Reach, Total Viewers
Page Views, Organic Traffic
Number of Attendees, Ticket Pricing Variations
CPM, CTR, CPC, CPA, CVR
Subscriptions, Open Rates, CTR
Pages per Session, Avg. Session Duration, Bounce Rate
Average Viewing Time, Audience Share, GR
CTR, DA, Average Ranking Position
Readers per copy
Time on Page, Scroll Depth, Social Shares, Asset Downloads
Interactions (Likes, Shares, Comments), Sentiment, CTR
Total Ad Inventory Revenue, Average CPM, Page RPM
Team Sponsorships, Media Rights, Product Placement
Annual Revenue per User, Total Customer Value, Churn Rate
Ticket Revenue per Event, Total Annual Ticket Sales, Event Sponsorships
With the right KPIs, you can build reports. Reports help you visualize your KPIs, compare them, and track your audience more efficiently. To be most effective, reports should be linked to core business areas or functions. Here are the top reports you should be looking at to measure business performance.
Content performance reports will allow you to track the performance of various content types (clustered by topic, length, keywords…) against different audience segments (age, location, gender…) to understand which types of content are resonating with the audience and feed this intelligence back into content development strategies to hyper-target specific audience segments.
Develop audience journey reports by finding out what channels audiences came from, what content converted them, and what their next engagement steps were. For example, combine CRM data with social platform platforms and ad channels data. Use cohort analysis reports to determine key acquisition or churn moments and compare audience segments with each other.
Social media engagement reports will display the total engagement with your audiences on social channels, from basic metrics (Likes, Shares, Comments), through Clicks driving traffic to your website or other properties, to complex analysis that displays Audience Sentiment and other parameters showing levels of awareness and advocacy among key target audiences.
Deconstruct the structure of your advertising revenue by analyzing the performance of each channel, or even individual inventory. Build detailed ROI and conversion rate reports for your sales team that demonstrate the value of your inventory and help attract and retain more advertisers and sponsors.
Once you’ve integrated all your data, determined your KPIs, and built various reports to track your success, you need to start drawing some insights from it all – and this where data analytics comes in.
Data analytics is where you can extract the most amount of value from your data and start generating insights.
For example, you can:
Understand which channels are bringing the most customers – and optimize your marketing budget accordingly.
Learn which groups of customers spend the most and what they are spending their money on – and target them with specific offers and sales.
Reveal which customers are least likely to make a second purchase and why – and develop an appropriate customer retention strategy.
This can be done manually – many M&E businesses have teams of data analysts whose job it is to do precisely this. Or you can let a computer do it for you, which is the next step – artificial intelligence.
AI, or Augmented, Analytics is where you enhance your data analysis by utilizing artificial intelligence to sift through it and draw out insights.
One of the key benefits is that AI can analyze data, find patterns, reveal anomalies, and generate insights at a scale, speed, and level of detail impossible for individual human analysts.
For example, with AI analytics you can:
Spot a drop in conversion rates among a specific customer segment that would be missed if you are only looking at aggregate data.
Identify a dip in ROAS on a specific campaign that again might be missed by human monitors.
Once making the decision to utilize AI for your data analysis, this also opens the door to the next step – predictive analytics
Predictive analytics is the process of using historical data to find patterns and make assumptions to predict future developments.
While strictly speaking this can be done by human analysts, the excruciating complexity of predictive analytics is AI’s playground. By using AI, marketers can draw out incredibly sophisticated predictive insights that would be extremely costly and time-consuming using human analysts, if not completely impossible.
For example, with predictive analytics you can:
Predicting the impact of content for specific audience segments including high-potential markets and demographics they should target, or forecast and reduce churn rates.
Forecasting media budget allocation at a total brand/campaign or channel level based on what is the most effective at achieving your KPIs.
Identifying potentially costly problems as early as possible before they become a major issue.
When it comes to understanding increasingly complex audience behaviors, this is a game-changer – the difference between only ever looking backward at what has already happened and instead, looking forwards and being proactive about what audiences are going to do.